Chart
The price chart filling the page, with the newest trades and bridge deposits beside it as they land.
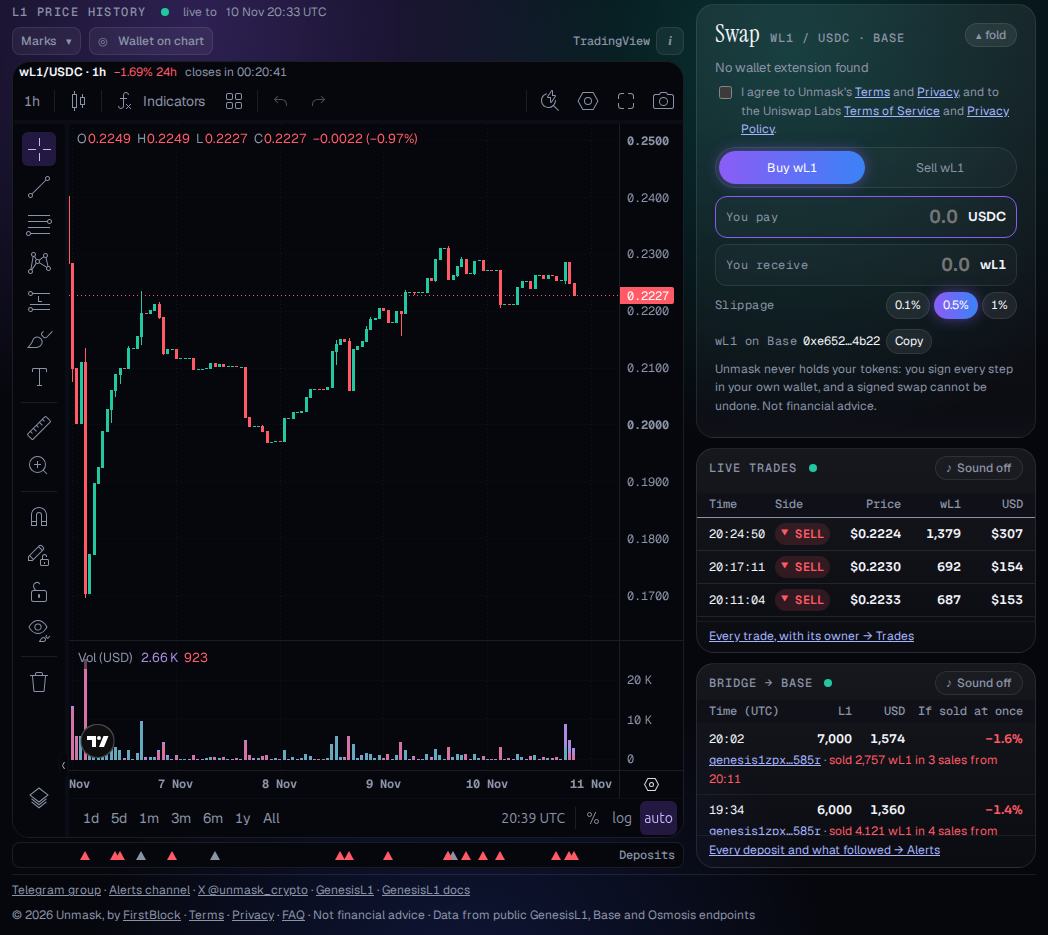
- The candles
From the pool's own price after each swap on Base, and from the venues before Base existed. An interval with no trade is drawn flat and grey at the previous close; it is never invented as a trade.
- Deposits under the plot
A bridge deposit is marked under the candles at its time, never over them.
- Live trades
The last 30 trades. A new row lights up; sound stays off until you turn it on.
- Bridge to Base
Each deposit of $100 or more, what it would move the price if sold at once, and where it is now.
Your view stays yours
The interval and the time range are in the link, so a link you share opens the same view.
Lines and levels you draw stay in your browser, shared with the chart on the Trades tab. Nothing is saved on the server.